Marker-based multi-camera extrinsic calibration for 3D body tracking

One of the main use cases of our metaverse lab is 3d body tracking. With Kinect DK’s SDK, 32 body joints can be detected or estimated from a single camera feed. The data for each joint include 3d coordinates (x, y, z) in the depth camera’s coordinate system, rotation matrix in quaternion (qw, qx, qy, qz), and a confidence metric. More details can be found in the SDK.

The results are already pretty good for application scenarios where there is a single subject and the person is facing the camera. Once there are multiple subjects in the scene or when the subject makes significant body movements, parts of the bodies are likely to be obstructed in the camera’s view. Although the SDK will still return data for all 32 joints, the estimated joint positions are often quite bad and should not be used for research. Another problem of the single camera tracking is the limited area coverage. Tracking performance art or sports activities would be difficult.

same subject – blue: camera 1, purple: camera 2

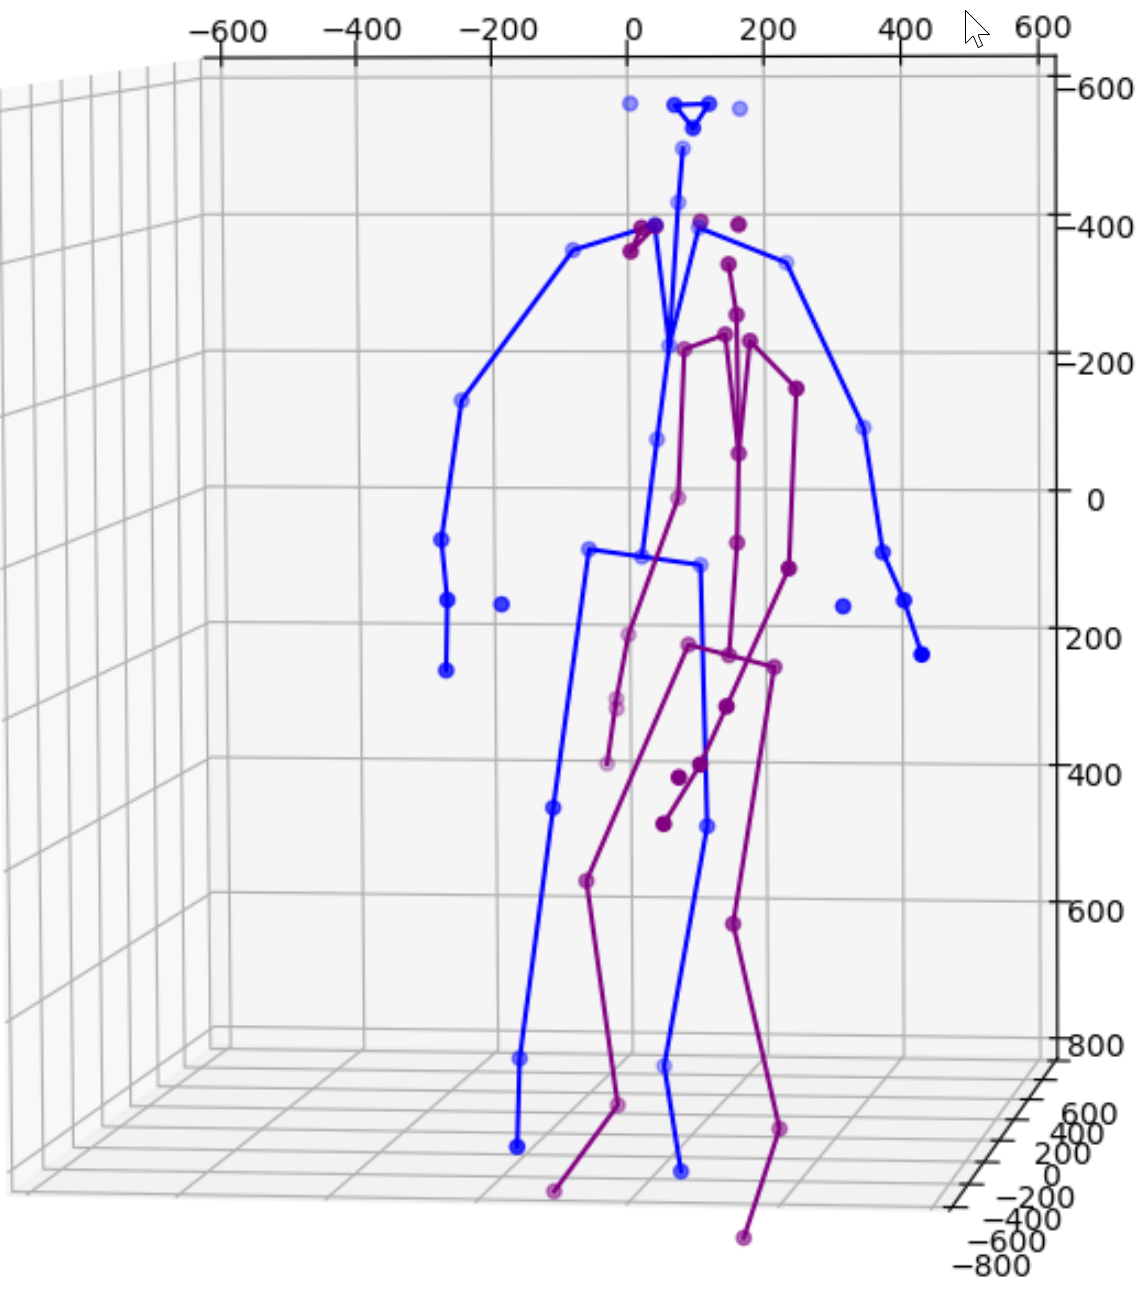
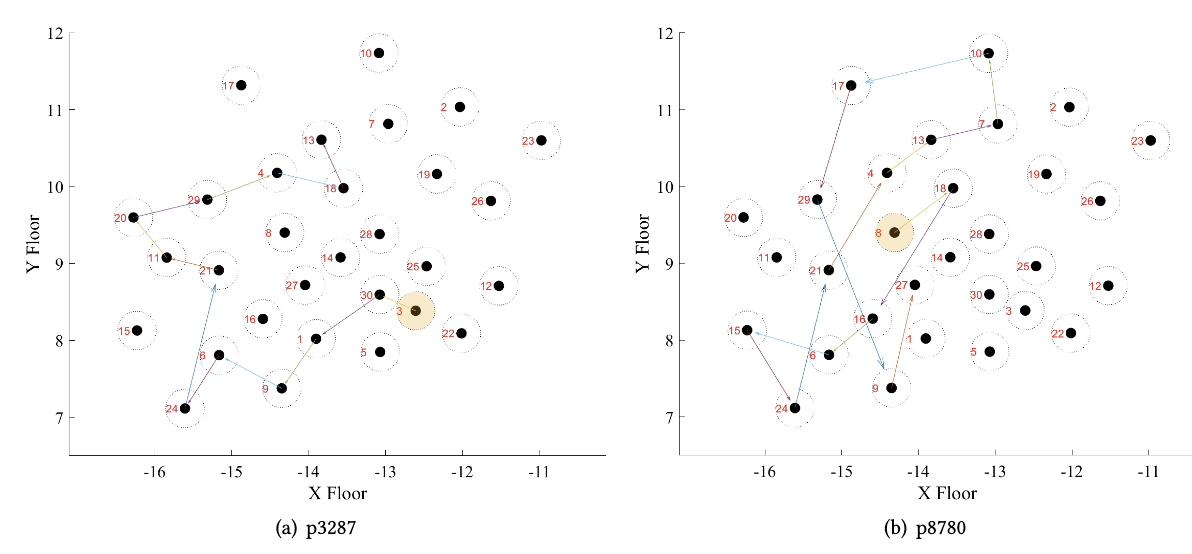
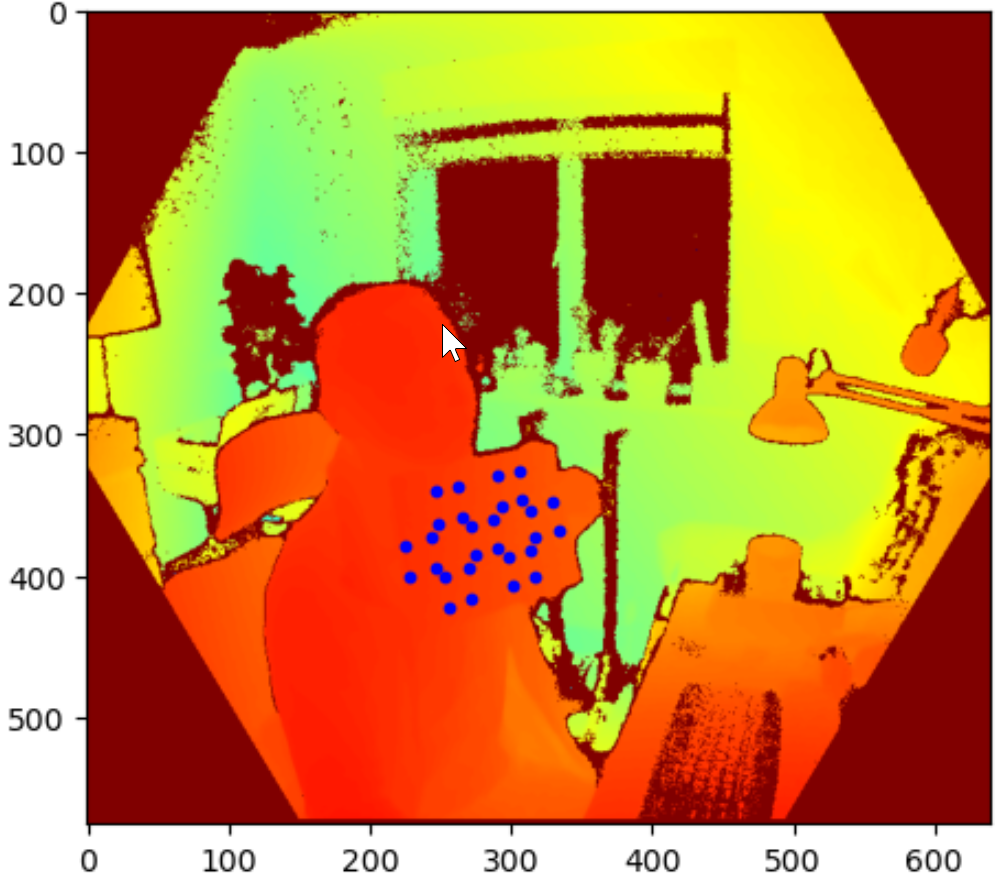
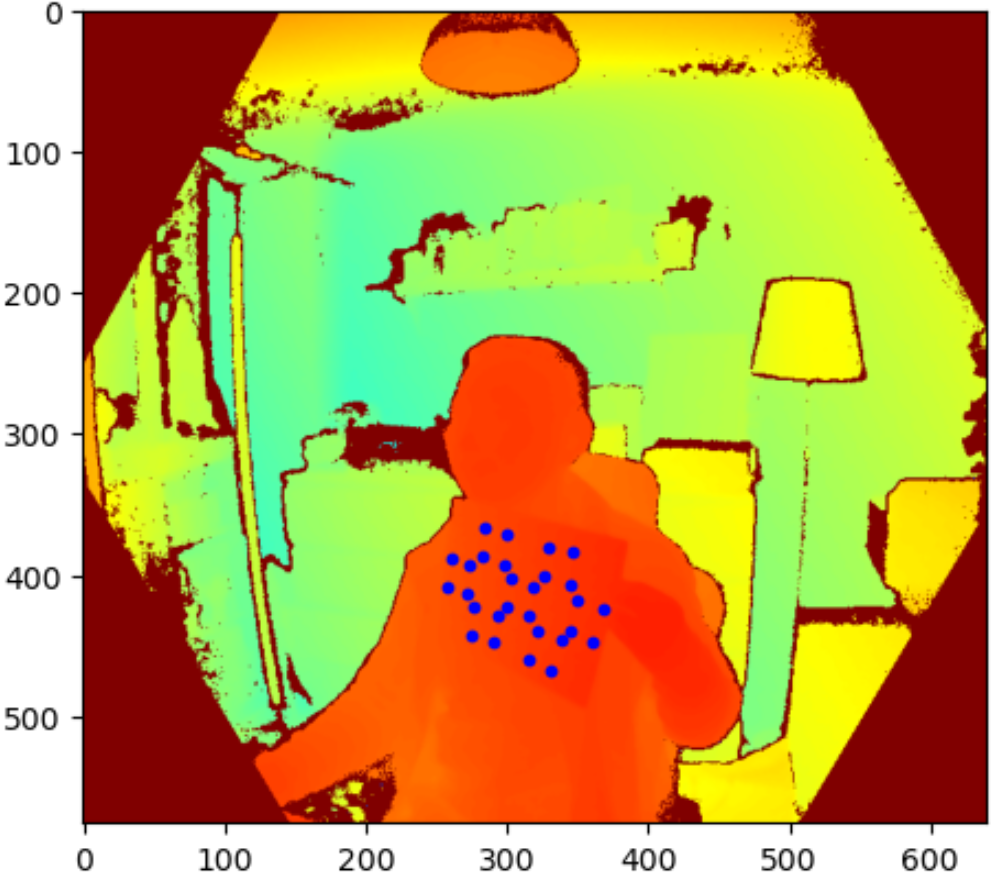
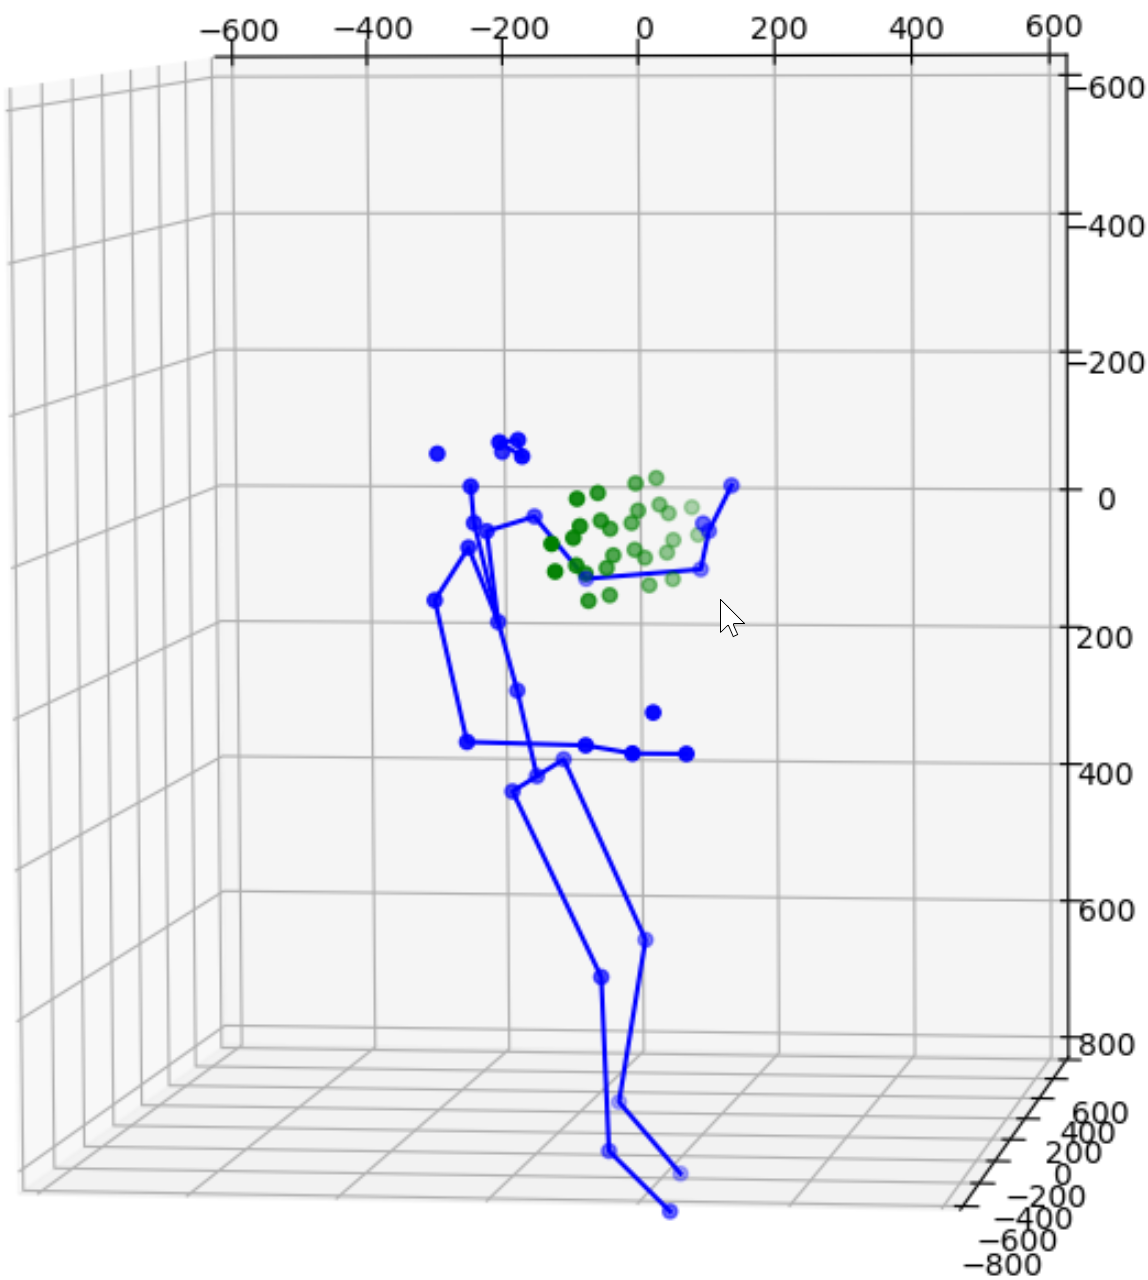
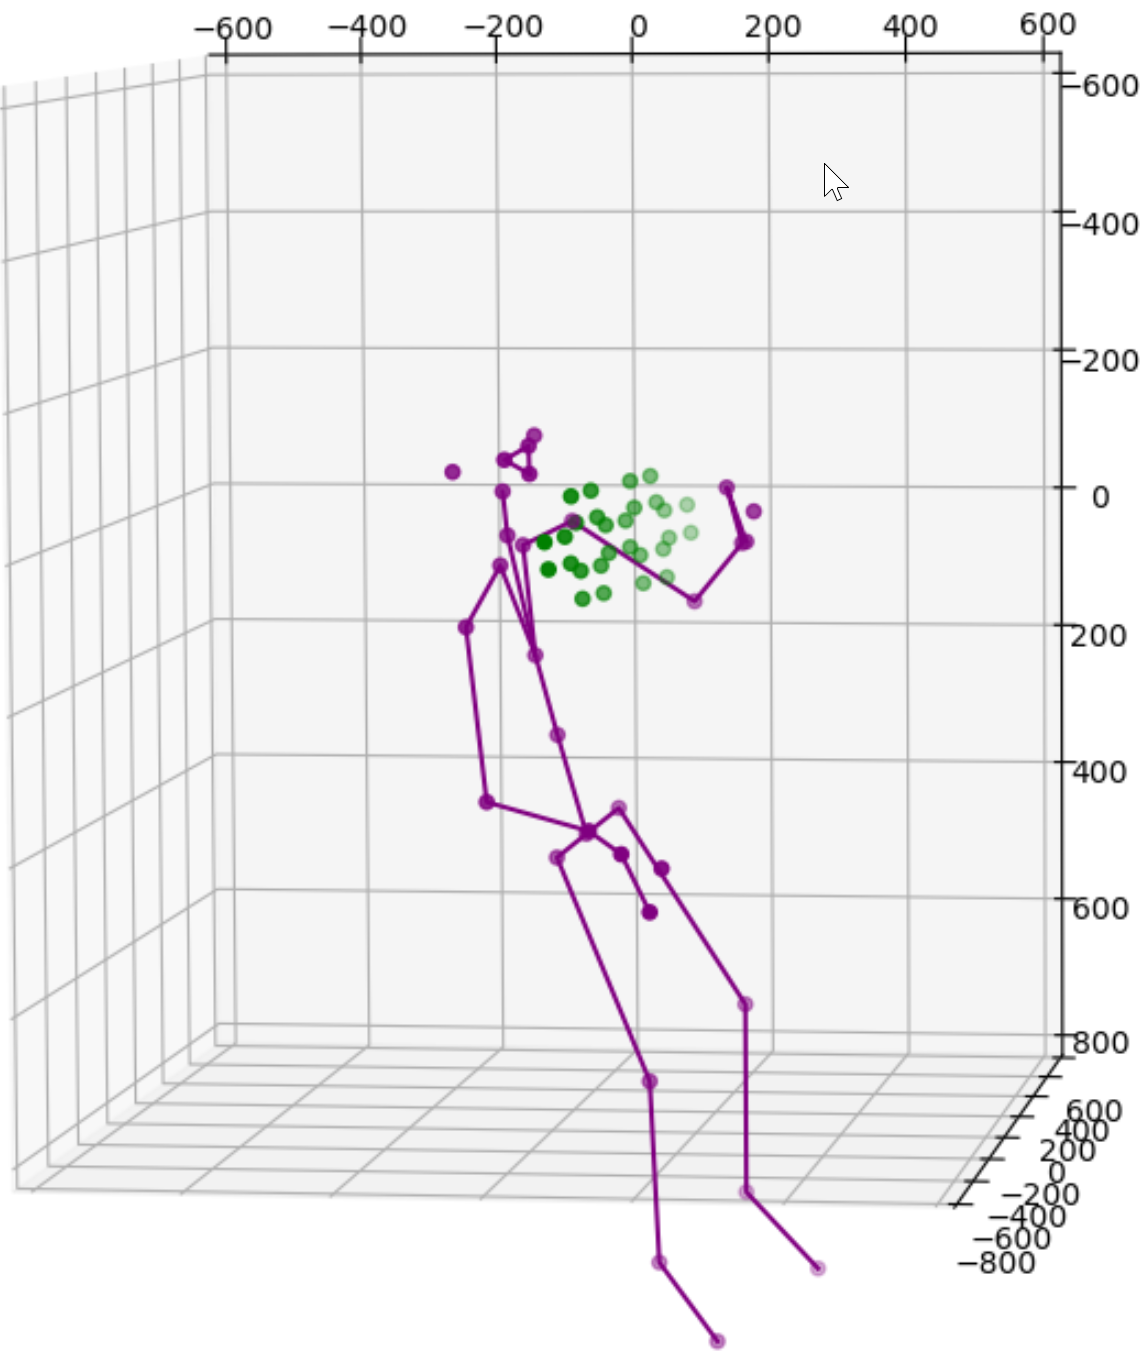
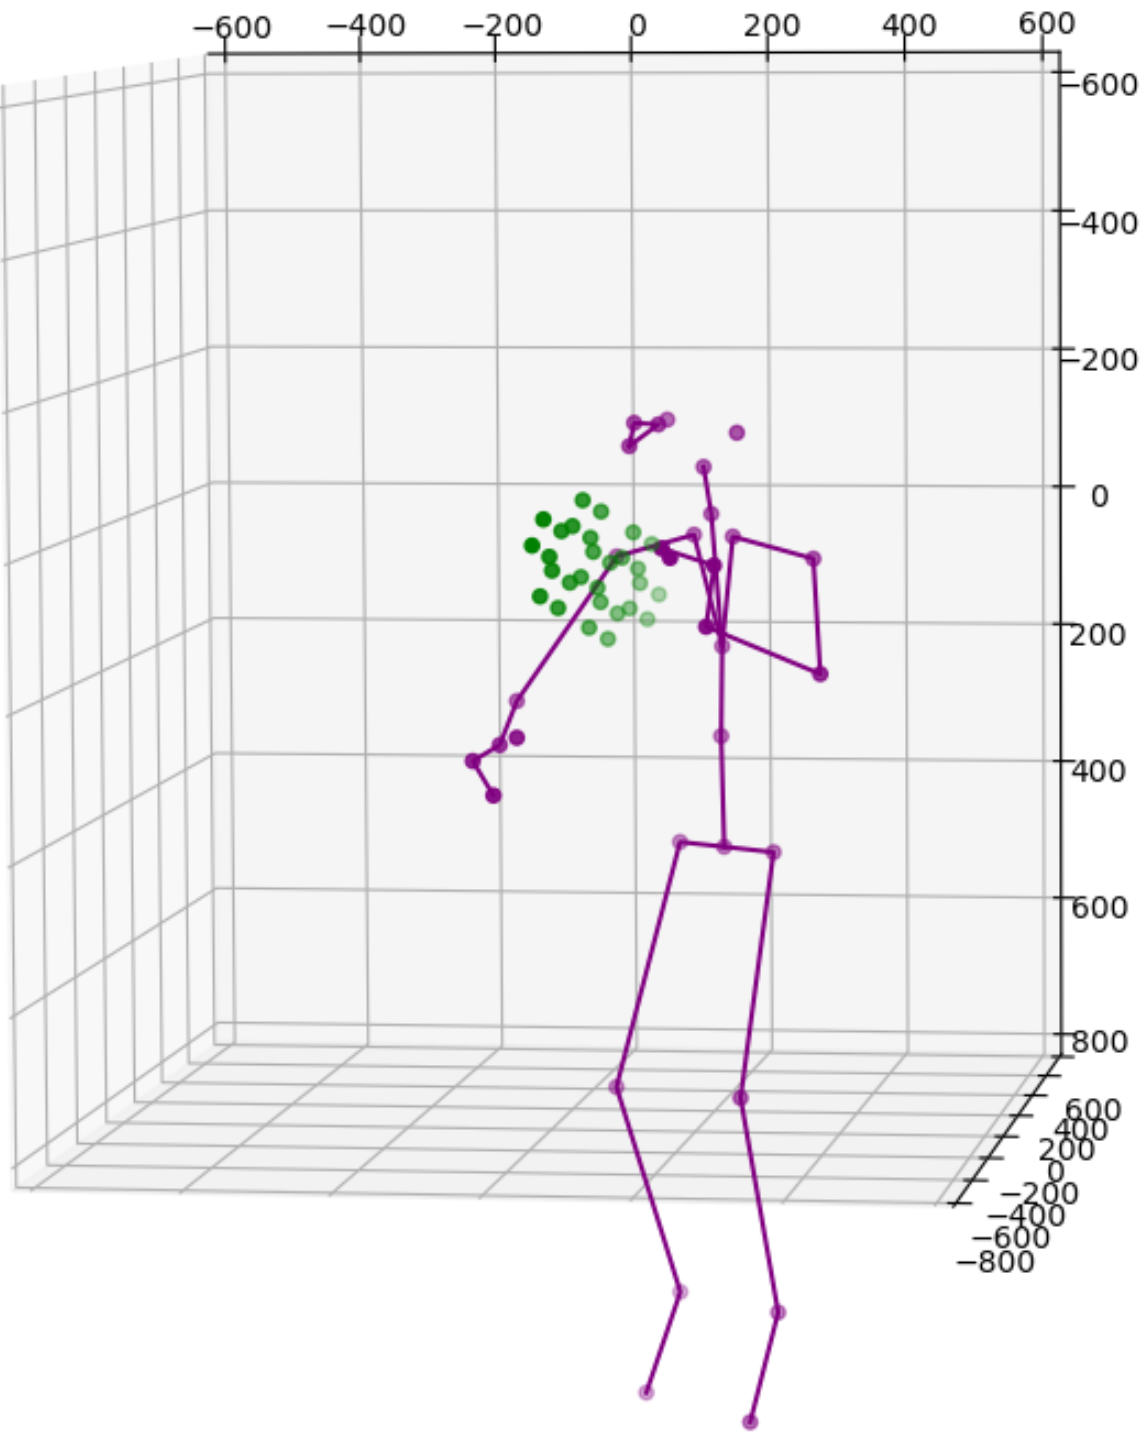
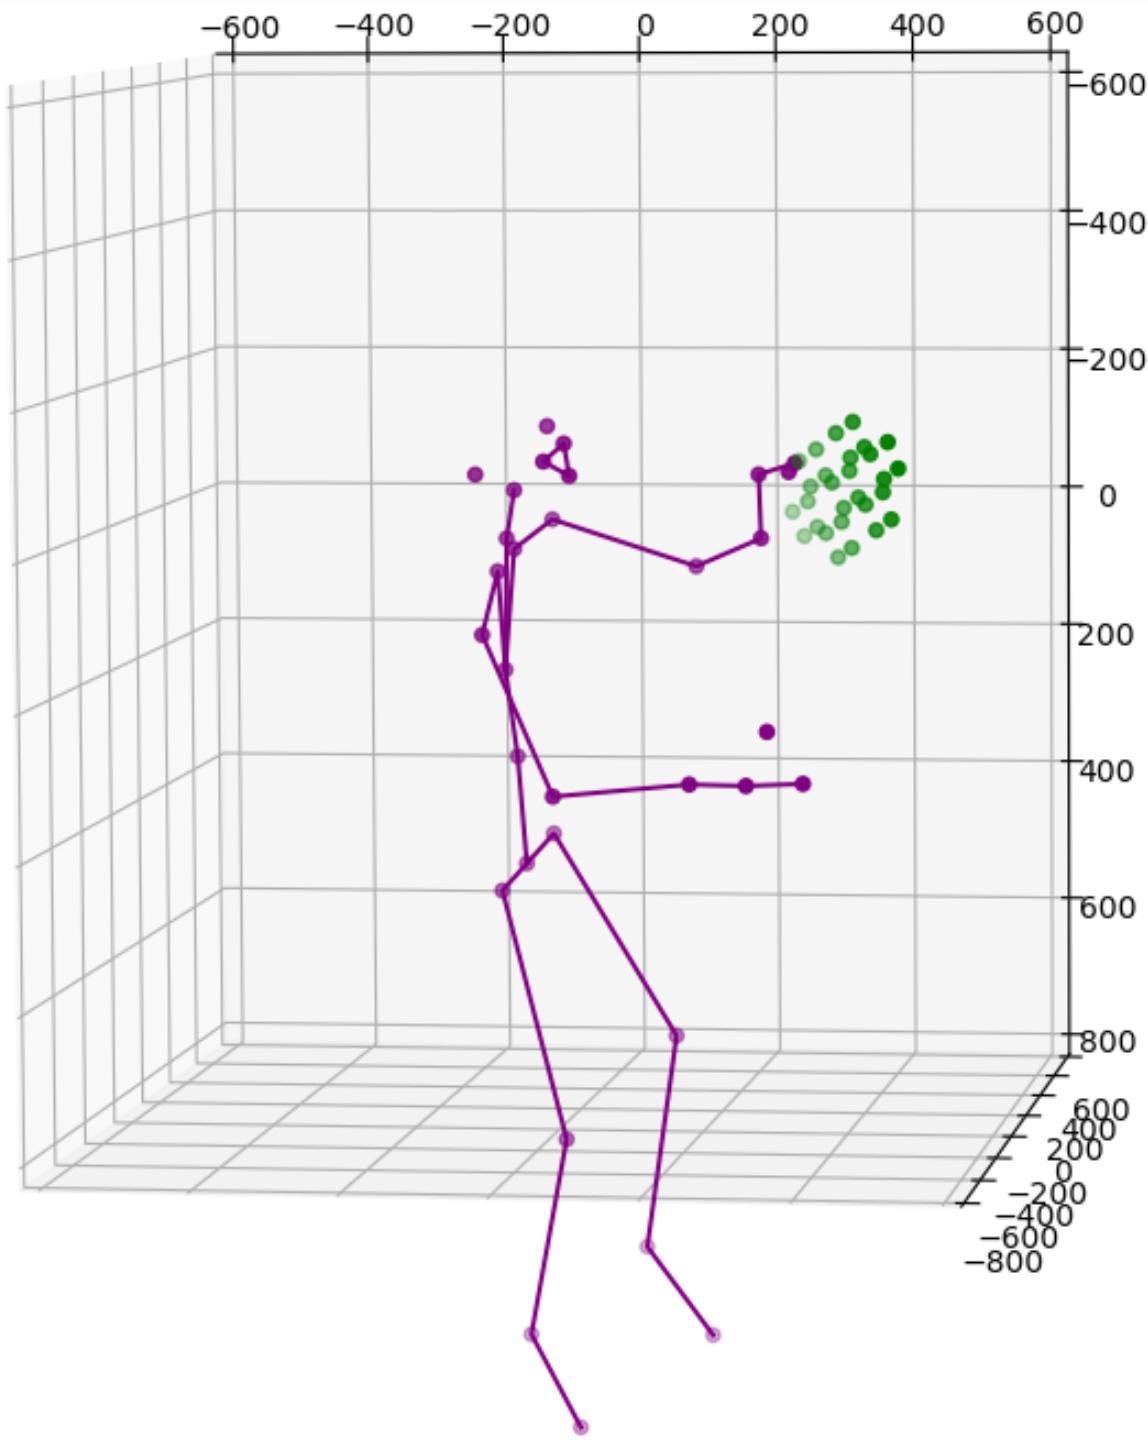
One solution is to simply add more cameras. Because each camera uses itself as the reference point to express the location of any object it sees, the same object will get different location readings from all cameras. For instance, the images above show data from 2 cameras of a single subject. Therefore we need to calibrate the data feeds from all cameras. This is normally done by transforming data from one coordinate system e.g., a secondary camera to a reference coordinate system e.g., the master camera. Ideally, the process will reshape the blue figure in the image above to match the shape of the purple figure exactly or vice versa. The transformation itself is straightforward using matrix multiplication but some work is needed to derive the transformation matrix between each camera pair. Luckily, OpenCV already includes a function estimateAffine3D() which computes an optimal affine transformation between two 3D point sets. So our main task is to get the associated 3D point sets from the 2 cameras. The easiest option to get the point sets is to reuse the 32 joint coordinates from cameras since they are tracking the same subject.

Feeding the joint coordinates to estimateAffine3D() will result in the above transformation matrix in homogeneous coordinates. I eliminated all low confidence joints to reduce the noise. In this case, the matrix is designed to transform readings from device 1 to device 2. The image below shows how the blue figure is mapped to the coordinate system of the purple figure. The result is nearly perfect from the chest above. The lower body is not great because they are not captured directly by our cameras.

Using body joints as markers for camera calibrations is promising but our results also clearly show some major issues: we can’t really trust the joint readings for accurate calibration. At the end of the day, the initial argument of the project was that each camera may have an obstructed view of the body joints. To find more reliable markers, I am again borrowing ideas from computer vision field: ChArUco.

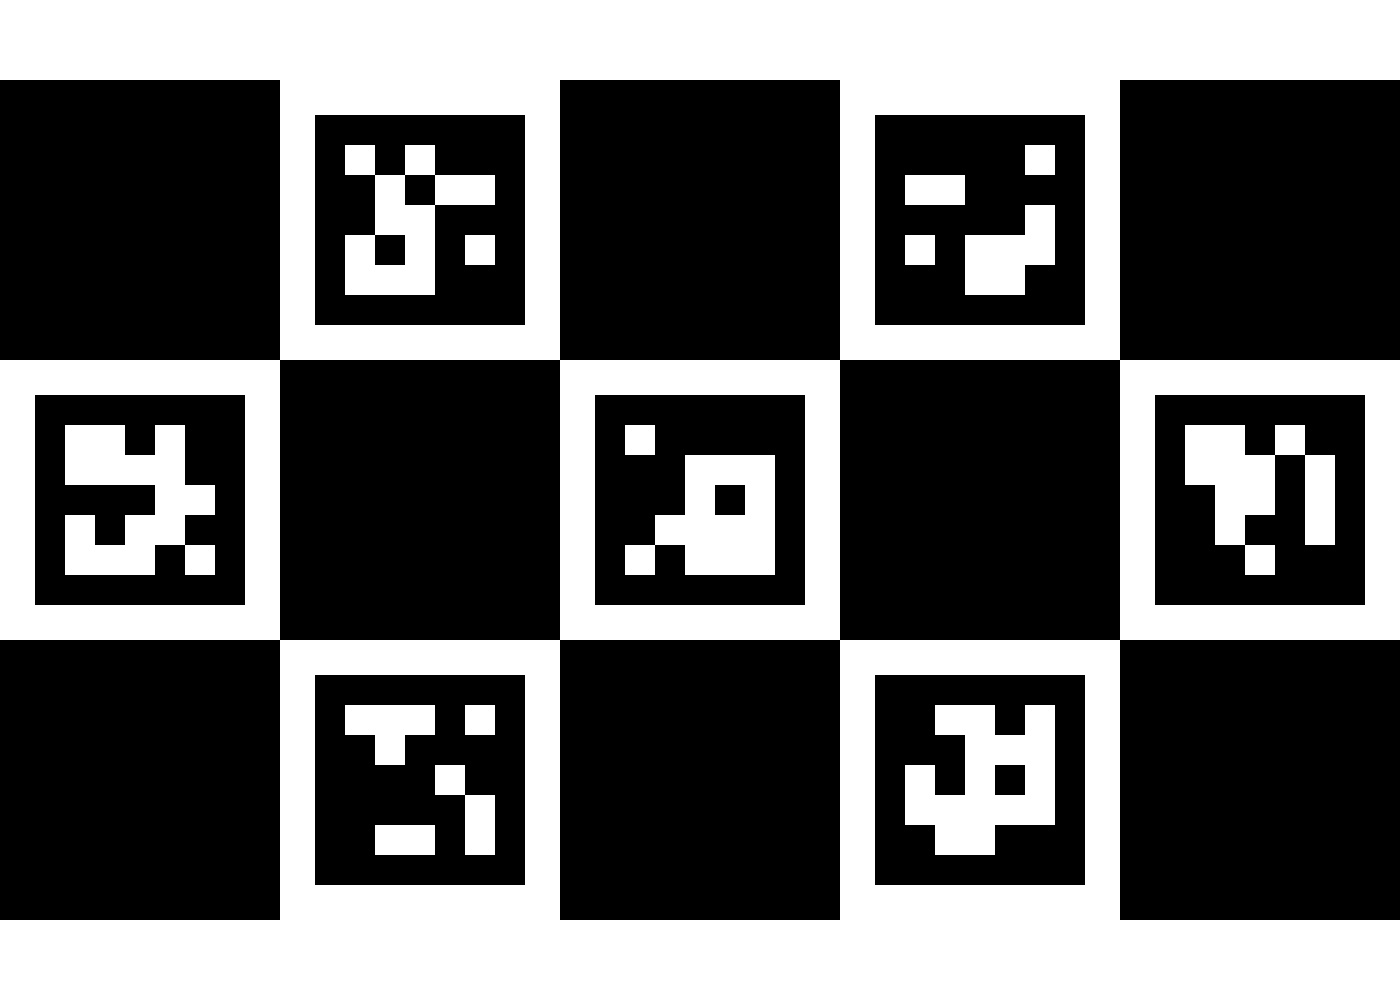
ArUco are binary square fiducial markers commonly used for camera pose estimation in computer vision and robotics. Using OpenCV’s aruco library, once can create a set of markers by defining marker size and dictionary size. the same library can be use to detect markers and their corners (x, y coordinates in a 2D image). The marker size determines the information fidelity, i.e., how many different markers is allowed. Each marker has its own ID for identification when multiple markers are present. The maximum dictionary size is therefore determined by the marker size but normally a much smaller dictionary size is chosen to increase the inter-marker differences. ChArUco is a combination of ArUco and chessboard to take advantage of ArUco’s fast detection and the more accurate corner detection permitted by the high contrast chessboard pattern. For my application scenario, ArUco’s corner detection seems accurate enough so ChArUco is only used to better match ChArUco boards on the front and back of a paper (more explanations below). The image below is a 3 by 5 ChArUco board with 7 ArUco makers (marker size 5 by 5 and dictionary size 250). This particular board has markers with the ID from 0 to 6.

The idea is now to print out this ChArUco board on a piece of paper and let both cameras detect all marker corners for calibration. So I fire up the colour camera of Kinect DK and get the following result. Yes, I am holding the paper upside down but that’s ok.

ChArUco marker detection on camera 2

With 28 reference points from each camera, the next step is to repeat what was done on the 32 body joints and generate a new transformation matrix. However, additional step is needed. The marker detection was done using the colour camera because the depth camera could only see a flat surface and no markers. So all the marker coordinates are in the colour camera’s 2D coordinate system, i.e., all the red markers points in above image are flat with no depth. These points are then mapped to the depth camera’s 3D coordinate system using Kinect DK SDK’s transformation and calibration functions.

https://learn.microsoft.com/en-us/azure/kinect-dk/use-calibration-functions

I am still looking for a better option but here are the 2-step approach:

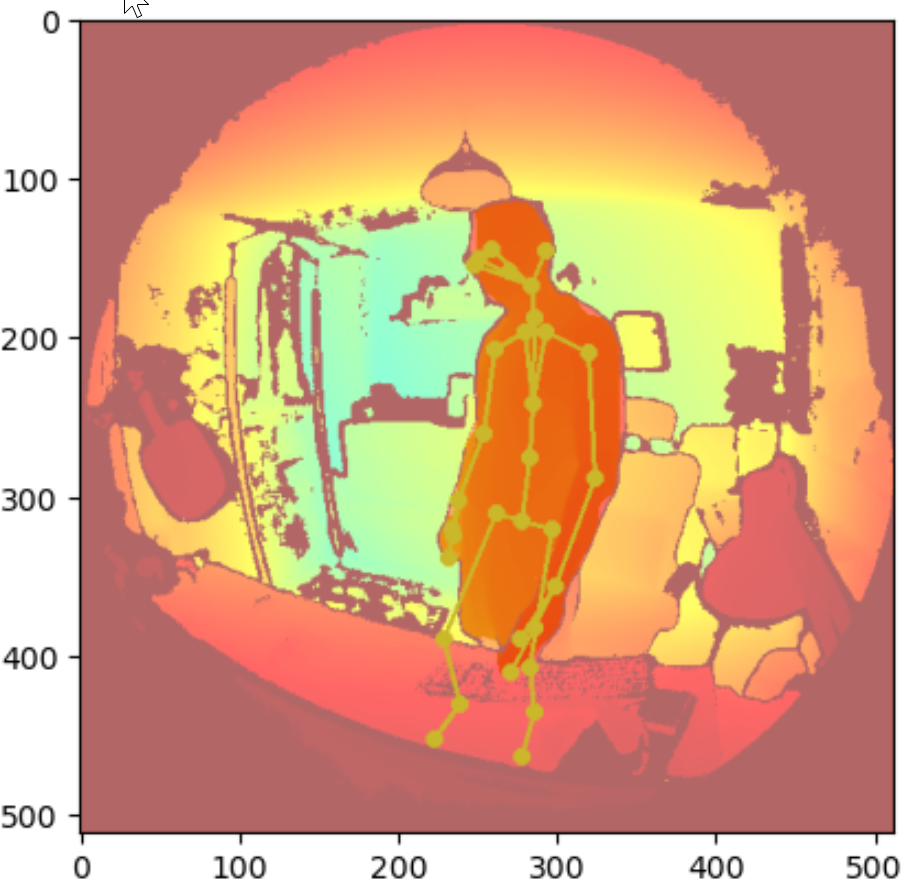
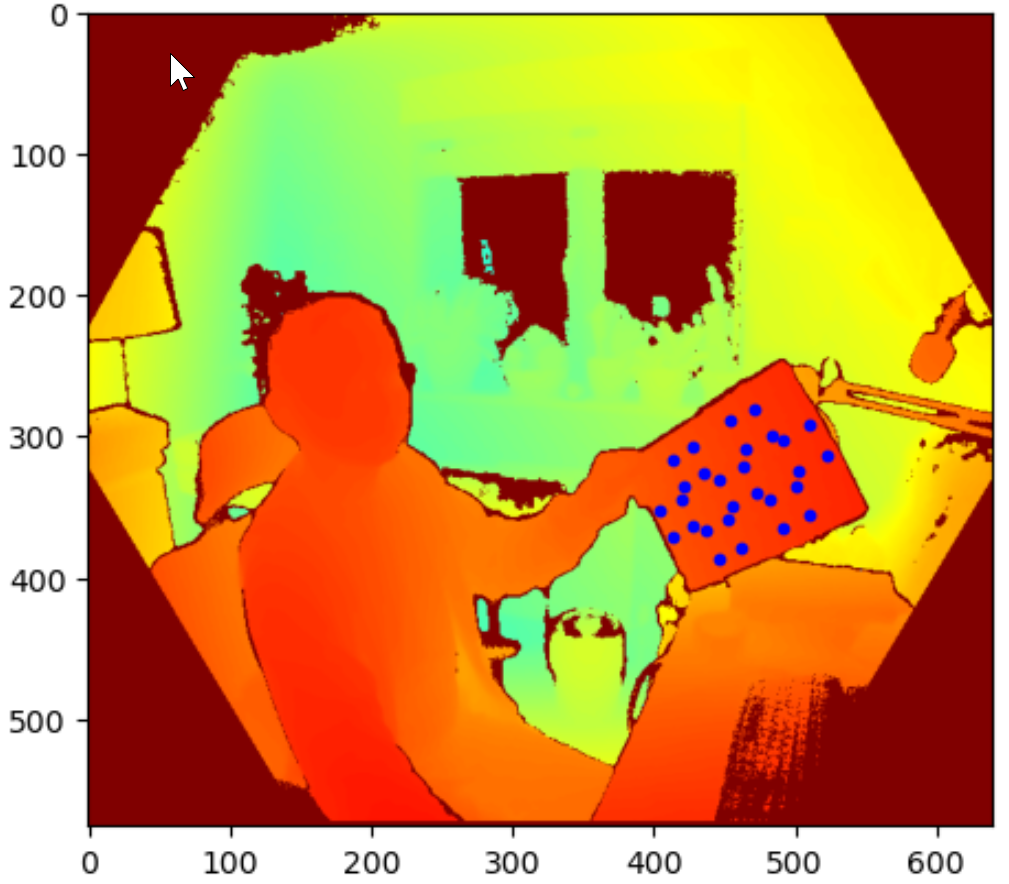
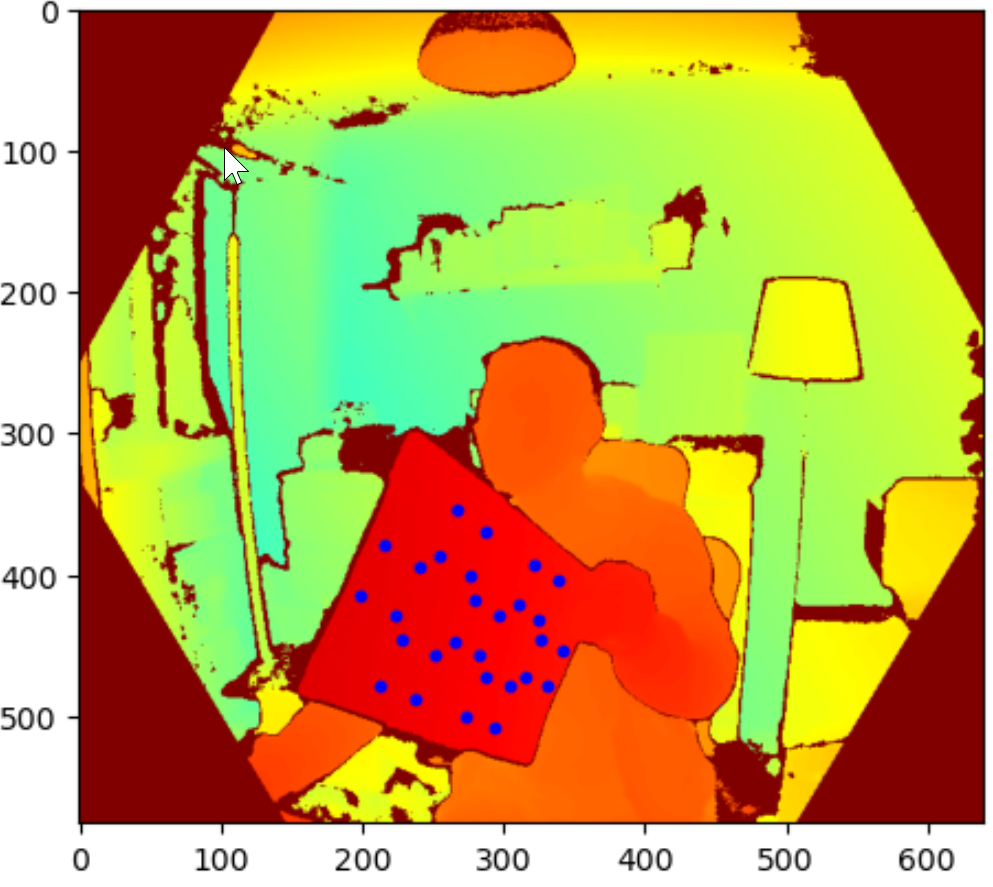
Firstly, all marker points are transformed from 2D colour space to 2D depth space as seem above (marker super-imposed on depth image). Knowing the locations of the markers on the depth image allowed me to find the depth information for all markers.

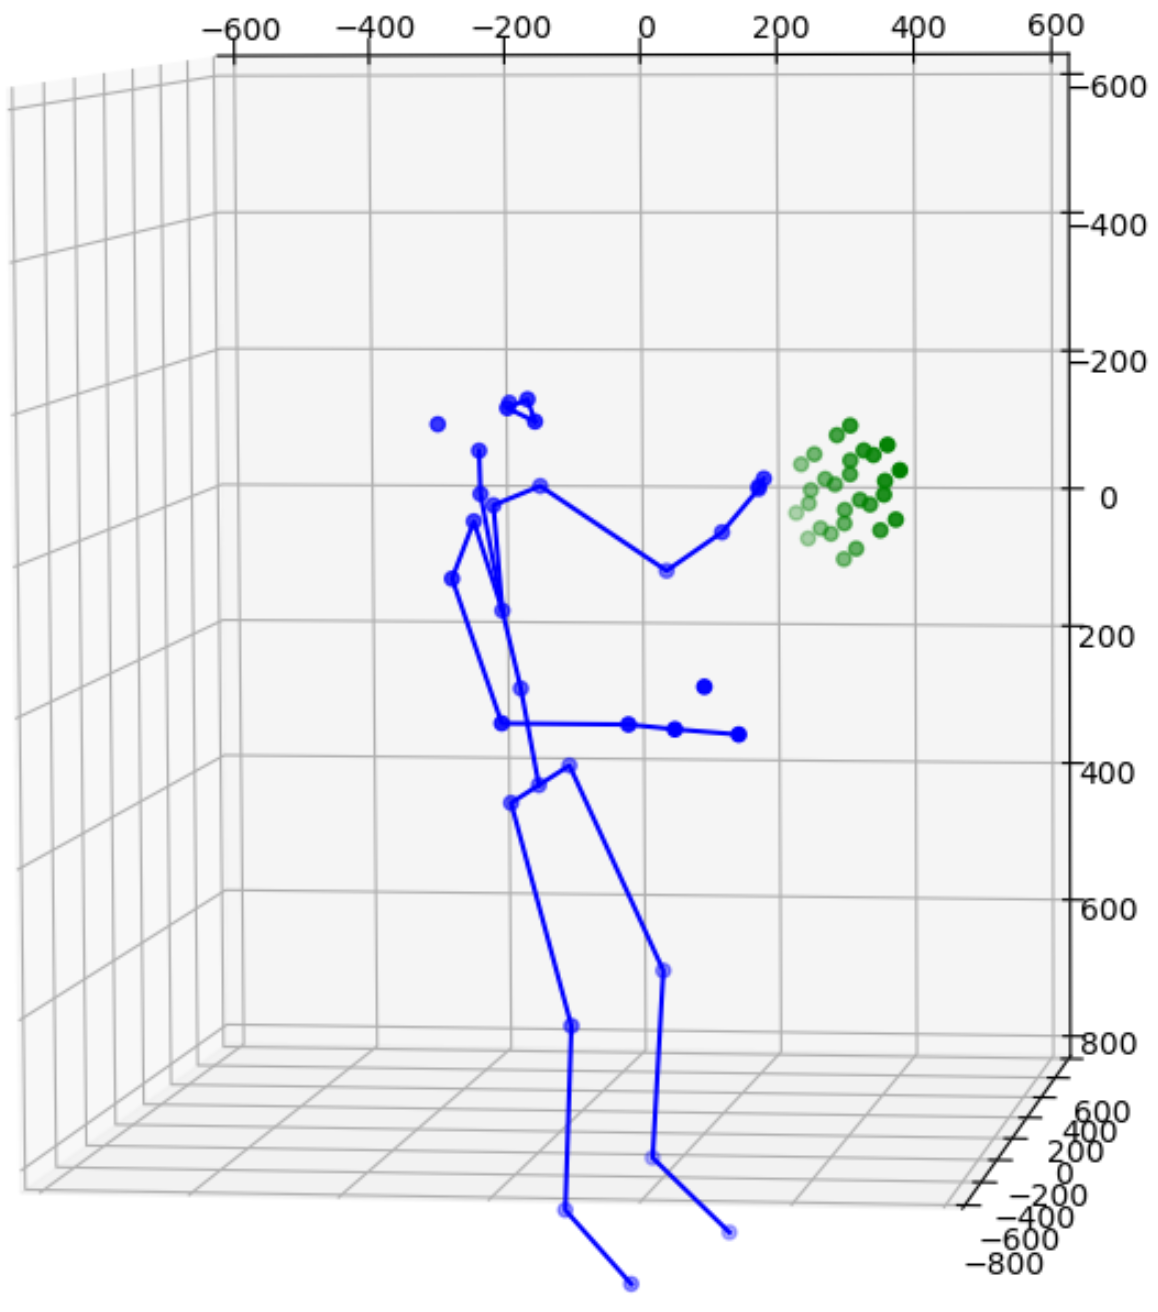
Next, markers are transformed from 2d depth space to 3d depth space to match the coordinate system for the body joints data. The images above show both makers and joints.

With the new sets of marker points a new transformation can be made from one camera to the other. All marker points are correctly mapped compared with data from the other camera. The joints are for reference only. I do not expect the joints to be mapped perfectly because they are mostly obstructed by the desk or the ChArUco board. I also eliminated a lot of small details here such many functions to keep the solution robust when some markers are blocked or failed to be recognised for any reason. Needless to say, this is only an early evaluation using a single ChArUco board on an A4 paper. I will certainly experiment with multiple boards while they are strategically positioned and board of different configurations.

Before I take this prototype out of the lab for a more extensive evaluation, there is another problem to solve. The current solution relies on both cameras having a good view of the same markers. This is fine only when the two cameras are not far apart. If we were to have 2 cameras diametrically opposed to each other to capture a subject from front and back, then it is very hard to place a ChArUco card viewable by both cameras. It would probably have to be on the floor while both cameras are tilted downwards. To solve this issue, I borrowed the idea from CWIPC‘s 2-sided calibration card.

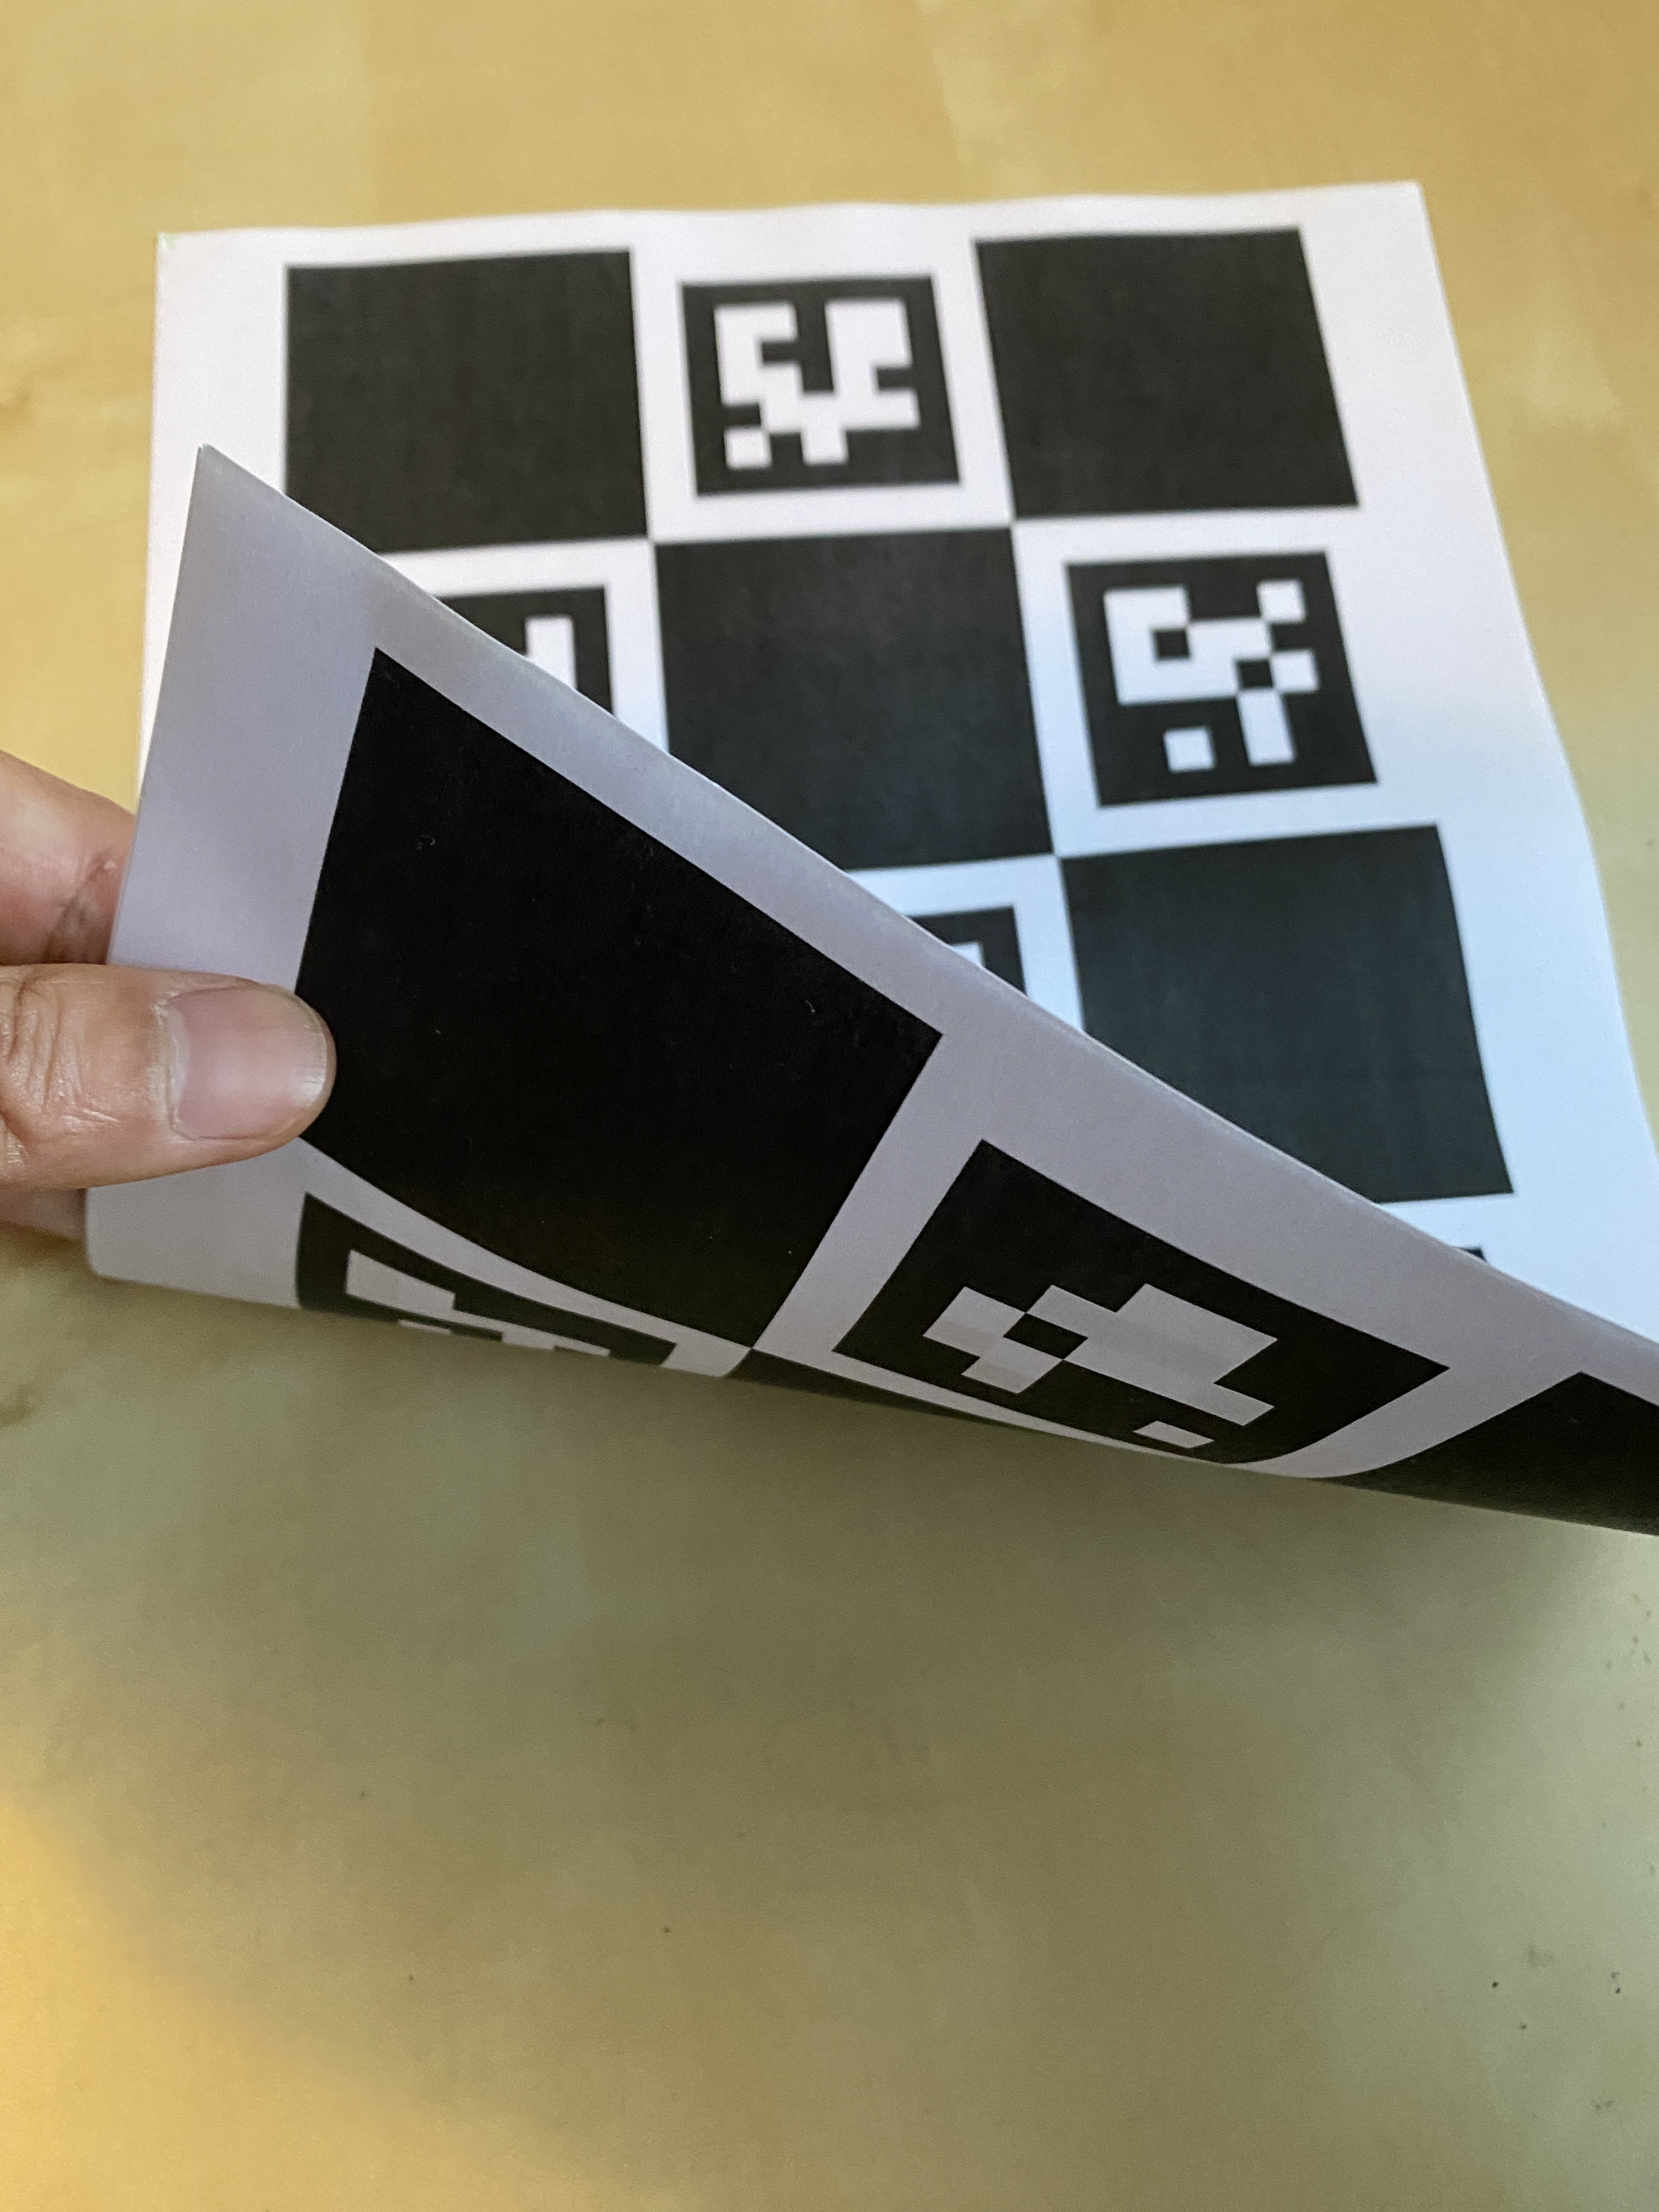
This 2-sided card has a standard ChArUco board on each side. The image above shows one side with marker ID 0 to 6 and the other side with marker ID 10 to 16. The corners of each marker on one side are aligned with a corresponding marker on the other side. So marker corners on one side are practically identical to marker corners detected by an different camera on the other side (with the error of the paper thickness that can be offset if necessary). A custom mapping function is developed to synchronise markers reported by cameras on each side of the paper. For instance, marker ID 0, 1, 2 are mapped to marker ID 12, 11, 15. The corner point order should also be changed so that all 28 points will be in the correct order on both sides. This approach requires some hard coding for each 2-sided card so I am hoping to automate this process in the future.

The following images show a test where I place this card between 2 cameras.

The transformation result is shown below. The solution is now also adaptive to detect whether multiple cameras are viewing the same side of the card or different sides of the card, and active different transformation options accordingly.

Overall, this is a simple and light-weight solution for multi-camera body tracking when the requirements for extrinsic calibration are not as significant as those of volumetric capturing. The next step for this project is real-world evaluation with selected use cases. There are still a lot of improvements to be made especially the automation and robustness of the detection and calibration.

[Publication] Unstuck in Metaverse: Persuasive User Navigation Using Automated Avatars

Mu, M., Dohan, M. “Unstuck in Metaverse: Persuasive User Navigation using Automated Avatars”, to appear in IEEE Communications Magazine, IEEE, 2023

Were you ever lost in a new place that you are visiting? What do you do when that happens? In an established and populous area, Google Maps or asking someone for directions may be the best choice. In rural locations, experienced mountaineers would use surroundings such as terrain features to track where they are.

Now, how about getting lost in VR? As the metaverse (large-scale virtual environments) become increasingly grander and more complex, it is inevitable that VR users will find themselves disoriented and effectively getting stuck in a strange corner of the virtual space. Research has shown that humans must plan their movements with sufficient specialist knowledge to navigate successfully. In the metaverse, users may not always be willing to spend the time to develop the required spatial knowledge. If the navigation support provided by user interfaces of VEs is insufficient, people will become disoriented when there is no vantage point from which the entire world can be seen in detail. Other research has also shown that VR users are susceptible to disorientation, particularly when using locomotion interfaces that lack self-motion cues. This is often caused by the confusion between the visual sense and other bodily senses while viewing an augmented or virtual reality world through a head-mounted display (HMD) which is not synchronized to real-world movements.

unstuck in the MMO game WOW (https://forum.turtle-wow.org/viewtopic.php?t=1628)

We clearly observed instances of user disorientation in our previous VR experiment involving large-scale abstract VR paintings, and we are determined to develop an unstuck feature to support user navigation in the metaverse. The term unstuck stemmed from the user function offered in open-world computer games such as World of Warcraft and New World. The function allows players to be freed from irreconcilable situations when their in-game characters could not move or interact with the virtual environments due to software bugs, graphics glitches or connection issues.

The plan is to design an unstuck feature that can develop itself organically and does not require human insertion of waypoints, routes, etc. This can be achieved by observing and modelling how the virtual space is used by users (community activities). For instance, we could comfortably identify a walkable path between location A and B because a number of different users moved from A to B in similar ways. The same principle can be applied to the entire virtual space so our model can learn: 1) all the possible paths discovered by users, and 2) how users navigate using these paths. The model then can make inferences of where a “normal” user would go (i.e., the next path they would use) based on where they have been. For new users, the inferences are used as recommendations for their next move. Once a user makes a new move (whether they pick an of the recommendations or not), their history of movement updates and new recommendations will be generated. The idea is very similar to some language models: by studying how humans construct sentences, a machine learning model can look at a prompt (a few leading words) and predict what the next word would be, hence gradually generating an entire sentence.

unstuck feature

Before we apply any time-series machine learning, there are a few things to sort out. I mentioned location A and B as examples but in the metaverse, there might not be any pre-defined landmarks and generally speaking it is not a good idea to arbitrarily set up some. An easy solution would be a grid system with uniformly distributed waypoints but it would mean that some popular areas won’t have enough waypoints to capture different paths and some deserted areas would have too many waypoints for no reason. The density and distribution of the location waypoints should roughly match how an area is accessed by users. The solution we came up with was simply clustering the user locations we observed from 35 users while considering the centroid locations and the size of each cluster.

clustering of user locations in VR
User movements across clusters (waypoints)

The next step is the easy part. We used a moving window to take a series of 5 consecutive steps for each user’s movements. The idea is to use the first four steps to predict the fifth step. We tried a classical feedforward network where the order of the input data is not considered and an LSTM-based network which considers the data as time series. Needless to say, the LSTM shows better accuracy in all metrics we employed. A further improvement was made when we added the location information to the input data. This means the model is aware of the ID of each location in input data and where they are (coordinates). The top1 accuracy is around 0.7 and the top 2 accuracy is around 0.9. This is pretty good for a 30-class classifier using a lightweight RNN architecture.

ground truth (left) and ML prediction (right)

The next step was to determine how the ML outcomes are communicated to the users in VR applications. A related work (https://ieeexplore.ieee.org/document/9756757) studied the effectiveness of 10 types of user navigation instructions in mixed reality setups. Arrows and avatars were the most preferred methods “due to their simplicity, clarity, saliency, and informativeness.” In their study, the arrows are “an array of consecutive arrows on the ground” and the avatars are “a humanoid figure resembling a tour guide”.

Navigation instructions compared in user study (https://ieeexplore.ieee.org/document/9756757)

We chose Arrows and Avatars as the two navigation methods for a comparative study. For the arrow method, the conventional choice of superimposing arrows on the ground would not work because there is no defined path in our virtual environment and user’s view of the ground is often obstructed by artwork at the waist level. We went for semi-transparent overhead arrows which are more likely to be in sight. They do slightly block the users’ view at a particular angle. Users can see through the arrows and no one has complained about them but we do need to explore different designs in the future. The avatar method is more successful than how we anticipated. Three avatars spawn in the virtual environment as “quiet visitors”. Each avatar takes one of the Top 3 recommendations from the ML model and travels in the recommended direction. They then change their directions when new recommendations are given, normally when the human user makes a substantial location change (i.e., reach a new waypoint).

The avatars are configured to be shorter than the average adult height to keep them less intimidating. They do not interact with human users and their role is implicitly persuading users to investigate recommended areas of the artwork. We use cartoonish virtual characters instead of more realistic ones as they are more generally acceptable (Valentin Schwind, Katrin Wolf, and Niels Henze. 2018. Avoiding the uncanny valley in virtual character design. interactions 25, 5 (September-October 2018), 45–49. https://doi.org/10.1145/3236673). We thought about adding head and eye movements but decided to leave it for future investigation due to concerns that these features might look too creepy.

The figure above shows data from participant iys who self-reported during the experiment that he was following avatars “lady” and “claire”. The participant started his exploration by walking into the artwork in a straight line. He then stood in one place for a while and asked where he should go before deciding by himself to follow the avatars and eventually making a counter-clockwise circular walk to experience the artwork. The circular path correlates with the similar counter-clockwise circular walk made by avatar “claire”. We also used some quantitative measurements such as walk distance (WD) to compare how users’ movements have been affected by the two guidance methods. We noticed that users do walk for longer distances and explore wider areas when arrows and avatars are enabled, though the differences may not be statistically significant. The paper also includes further analysis using eye gaze data to evaluate how users engage with the navigation feature.

There is still so much to do on this research topic but I am quite pleased to see another close-the-loop project where we started everything from scratch, completed prototyping, data collection, and machine learning modelling, then put the results back in the application to evaluate its effectiveness.

Smart campus data visualisation “zoo”

[UPDATE] I stopped the AWS instance due to the cost. They are now “on-demand”.

Finally got a bit of time to move the code and some sample data to a public server. The data are all real but not live. Also, I am using an old version of Highcharts.js. They are sitting on tiny t3.micro so be gentle.

data volume
area heatmap
floor activities (wait a few seconds for data to load)
crowd distribution dial
cross-area movements dependency wheel

crowd distribution streamgraph

area heatmap on floor plan

Lastly, the monstrous scatterplot shows how each device moves on a day. This may freeze your browser. Wait >20 seconds for data to load and DO NOT refresh the page.

device movements scatter plot (wait many seconds for data to load and DO NOT refresh)

Metaverse Lab – volumetric / motion capturing and streaming

I’ve led a successful Research Capital Fund at UON to help the university invest in key areas that can extend its research and innovation impact leading to the next REF submission. The Fund will support the first-phase development of a Metaverse Lab for health services, education, training, and industrial innovations.

The Metaverse Lab will address the single biggest challenge of VR/XR work at the university: many colleagues who wanted to experiment with immersive technologies for teaching and research simply didn’t have the resources and technical know-how to set up the technology for their work. We’ve witnessed how this technical barrier has blocked many great ideas from further development. My aim is to build an environment where researchers can simply walk into the Lab and start experimenting with the technologies, conducting user experiments, and collecting research-grade data.

Volumetric capturing using multiple Kinect DK (k4a) RGB-D cameras

The Lab includes an end-to-end solution, from content generation to distribution and consumption. At the centre of the Metaverse Lab sits an audio-visual volumetric capturing system with 8 RGB-depth cameras and microphones. This will allow us to seamlessly link virtual and physical environments for complex interactive tasks. The capturing system will link up with our content processing and network emulation toolkit to prepare the raw data for different use scenarios such as online multiparty interaction. Needless to say, artificial intelligence will be an important part of the system for optimisation and data-driven designs. There will be dedicated VR/XR headsets added to our arsenal to close the loop.

The two screen recordings below show the 3D volumetric capturing of human subjects using 4 calibrated cameras. This particular demo was developed based on cwipc – CWI Point Clouds software suite. The cameras are diagonally placed to cover all viewing angles of the subjects. This means that you can change your view by moving around the subject. The cameras complement each other while the view from one camera is obstructed. One of the main advantages of such live capturing systems is its flexibility. No objects need to be scanned in advance and you can simply walk into the recording area and bring any object with you.

Single-subject volumetric capturing using 4 camera feeds.
Volumetric capturing of 2 subjects using 4 camera feeds.
Depth camera view

The system can be used for motion capturing using the Kinect’s Body Tracking SDK. With 32 tracked joints, human activities and social behaviour can be analysed. The following two demos show two scenes that I created based on live tracking of human activities. The first one shows two children playing. The blue child tickles the red child while the red child holds her arms together, turns her body and moves away. The second scene is an adult doing pull-ups. The triangle on the subject’s face marks their eyes and nose. The two isolated marker points near the eyes are the ears.

“Two children playing”
“Pull ups”

We envisage multiple impact areas including computational psychiatry (VR health assessment and therapies), professional training (policing, nursing, engineering, etc.), arts and performance, social science (e.g., ethical challenges in Metaverse), esports (video gaming industry), etc. We also look forward to expanding our external partnerships with industrial collaborations, business applications, etc.

Paper on data-driven smart communities to appear in IEEE Network Magazine

A smart campus project started in 2019 finally sees its first academic paper titled “Network as a sensor for smart crowd analysis and service improvement” appear in a Smart Communities special issue of IEEE Network Magazine. It was meant to be a pure engineering project to showcase the potential of campus WiFi data for service optimisation and automation but it quickly became a data science project too when we started to gather and process hundreds of millions of anonymised connectivity data. In summary, we monitor how connected devices switch between WiFi APs and use machine learning to model crowd behaviours for predictive analysis, anomaly detection, etc. Comparing with conventional crowd analysis solutions based on video cameras or WiFi probing. our solution is less intrusive and does not require the installation of additional equipment. Our SDN infrastructure is the icing on the cake as it offers a single point for data aggregation.

Abstract:

With the growing availability of data processing and machine learning infrastructures, crowd analysis is becoming an important tool to tackle economic, social, and environmental challenges in smart communities. The heterogeneous crowd movement data captured by IoT solutions can inform policy-making and quick responses to community events or incidents. However, conventional crowd-monitoring techniques using video cameras and facial recognition are intrusive to everyday life. This article introduces a novel non-intrusive crowd monitoring solution which uses 1,500+ software-defined networks (SDN) assisted WiFi access points as 24/7 sensors to monitor and analyze crowd information. Prototypes and crowd behavior models have been developed using over 900 million WiFi records captured on a university campus. We use a range of data visualization and time-series data analysis tools to uncover complex and dynamic patterns in large-scale crowd data. The results can greatly benefit organizations and individuals in smart communities for data-driven service improvement.

An associated dataset that includes over 300 million records of WiFi access data is available at: https://bit.ly/3Dmi6X1.

Automating mental health treatment

Today marks the start of a new research project on automating mental health treatment using VR and game design. This short project is funded by the University’s Support for Innovation and Research Ideas, Policy and Participation (SIRIPP) grant. The SIRIPP grant supports staff in developing their idea and activity and helps progress to further external funding and support routes.

The project aims to prototype a VR-based mental health treatment solution for internalising disorders that can be administered by patients at home. The solution must be effective, fun, trustworthy, and secure. To achieve this goal, we’ll need to find ways for innovations from human-computer interaction, game design, psychology and artificial intelligence to work together and synergise.

An eye-gaze controlled virtual game prototype for mental health treatment (Developed by Murtada Dohan and Andrew Debus. All Rights Reserved)

The project is led by:

  • Mu Mu (HCI and Data Science), Faculty of Arts, Science and Technology, UON
  • Jacqueline Parkes (Applied Mental Health), Faculty of Health, Education and Society, UON
  • Andrew Debus (Game Design), Faculty of Arts, Science and Technology, UON
  • Kieran Breen (Psychology), Head of Research and Innovation, St Andrew’s Healthcare
  • Paul Wallang (Psychology), Director of Innovation and Improvement, Cardinal Clinic

The main objectives of the project are:

  • Develop research protocols and ethics guidelines for automated VR treatment.
  • Prototype a VR game with interactive tasks that mimic manualised psychotherapy treatment.
  • Conduct small-scale user trials and capture research-grade data to support follow-on projects
  • Expand our network of collaborators (communities, academics, businesses, policymakers, etc.)

Feel free to contact me (mu.mu@northampton.ac.uk) if you wish to know more about our project.

Using VR and machine learning for art and mental health

[ update: the research idea described in this post has supported a successful outline proposal to EPSRC High-risk speculative engineering and ICT research: New Horizons ]

In the past few years, we have had a series of projects on capturing and modelling human attention in VR applications. Our research shows that eye gaze and body movements share a pivotal role in capturing human perception, intent, and experience. We truly believe that VR is not just another computerised environment with fancy graphics. With the help of biometric sensors and machine learning, VR can become the best persuasive technology known to HCI designers. In a recent project, we demonstrated how machine learning can be automated to study visitor behaviours in a VR art exhibition without any prior knowledge of the artwork. The resultant model then drives autonomous avatars (see below) to guide other visitors based on their eye gaze and mobility patterns. With the “AI avatars”, we observed a significant increase in visitors’ interactions with the VR artwork and very positive feedback on the overall user experience.

Image generated by Murtada Dohan, a PhD student at UoN.

The COVID-19 pandemic and its prolonged impact on health services made us rethink our research priorities. While we are still enthusiastic about digital arts, we wanted to make good use of our VR and data science know-how for healthcare innovations. Using VR and AI in healthcare is not a new idea. There are already tons of existing research on VR-based therapies, especially for the treatment of phobia and dementia. AI has been used to develop chatbots, to detect COVID-19 symptoms, etc. The research we’ve seen so far are very promising from an academic perspective but most of them aim at augmenting traditional practices for improved outcomes. This means that any developed application will still need to be operated by a technician in a controlled setting. Recognising the healthcare innovations in the research communities, we are interested in a new form of design that can deliver automated or even autonomous assessment and treatment of diseases in a remote location, e.g., patients’ own home or an easily accessible community centre. This will ultimately help reduce the amount of health care appointments and patients’ trips to hospitals.

The pandemic has added long-lasting impacts on public mental health due to social isolation, loss of coping mechanisms, reduced access to health services, etc. We believe VR and AI research should see a major shift from exploratory proof-of-concept to product-focused development with wider public engagement. Just like how every Tesla car and every Google search improves their underlying ML models, mental health innovation must aim at large scale user trials to achieve any major transformation. To this end, we now pair with the R&D department of a leading mental health institution to engineer new VR applications for new adventures. We hope that customised VR stimuli and NLP dialogue engines will lead to more effective treatment that was not possible in the past due to constraints in the physical world. We are also quite excited about the opportunities to automate the assessment of mental disorders through biometric sensors and machine learning.

The development of BSc AI and Data Science programme

This is a belated post on developing a new BSc AI and Data Science (Hons) programme. This programme has successfully passed validation in early 2022 and we are now accepting applications for the 22/23 academic year.

The development of the new programme is an answer to the growing demand for machine learning engineers and scientists in the UK job market. Using AI and machine learning to increase productivity, save cost, and assist new designs is no longer a privilege for large tech companies and government organisations. In the past few years, we have worked with many small and micro-businesses that are enthusiastic about adopting AI techniques and recruiting AI talents. Although we have been teaching AI-related topics such as computer vision, deep learning and graph databases within our existing programmes for many years, it is now imperative to design a dedicated BSc programme to capture recent advancements in AI as well as the legal, ethical, and environmental challenges that may follow. I am pleased to have the chance to be part of this development as the programme lead.

We had two parallel procedures taking place: Computing market research and CAIeRO Planner. The market research was carried out by key academics who are currently teaching AI-related modules. We did a few case studies of similar programmes offered by our main competitors and current job vacancies for ML engineers, researchers, and data analysts. We noticed that a lot of AI programmes are offered as a collection of discrete data science and machine learning modules that don’t synergise with each other. While this setting may give prospective students the impression of a rich and sophisticated course, students do not get the best value while hopping between those modules. We wanted to follow the theme of responsible and human-centred AI while providing a clear path to success and a sense of accomplishment along the way. The research on the job market was especially important because we wanted to continuously champion hands-on learning and practical skills. This practice gave us a general idea of the toolset, frameworks, workflow, and R&D environment that our students will be expected to master in their future workplace.

Planning on the technical content is only half of the story. The University has a large and dedicated Learning Technology team to support any activities on the module and programme development and improvement. We had two learning technologists assigned to our programme to support detailed designs at both programme and module levels. We used an in-house planner Creating Aligned Interactive educational Resource Opportunities (CAIeRO) to guide the exercises.

We started with the “look and feel”, learning outcomes, mission statement and assessment strategy for the programme as a whole using interactive tools and sharable environments such as padlet. All members of the programme team had equal inputs to the design. The whole process was carried out through multiple online sessions over a few weeks. Because everyone came to the meeting fully prepared, the sessions were really effective and super engaging. The programme level design then became the blueprint for module-level designs to ensure coherence and consistency across all modules.

We then identified four new modules for the programme: Mathematics for Computer Science, Introduction to AI, Natural Language Processing, and Cloud Computing and Big Data. We also reworked some existing modules such as Advanced AI and Applications, and Media Technology to better accommodate the programme learning outcomes.

Developing module-level learning outcomes can be challenging, especially when we need to maintain the coherence between modules at the same level. As student-facing documents, the module specifications also need to be clear and concise. We used a toolkit called COGS which stands for Changemaker Outcomes for Graduate Success. It includes a series of guidelines that help staff write clear and robust learning outcomes that are appropriate to the academic level of study in order to clarify for students what is expected of them across the different stages of their study. I found this tool extremely useful when I developed the new modules, knowing that my colleagues would be using similar languages for the related modules.

We also took a few extra steps to make sure that the learning outcomes will be assessed using a range of tools including assignment, project, time-constrained assessment and dissertation. Most modules also offer a mix of face-to-face and a small number of online contact hours for active and blended learning. This will allow students to work on subject tasks online before they join the classes, a practice that could greatly improve student engagement.

If you are interested in more details about our programme, please don’t hesitate to contact me.

Product detection in movies and TV shows using machine learning – part 5: Finding sweeties quick

In Part 4, I made a start with establishing a new training dataset by harvesting publicly accessible photos on social media. The main benefit of using user generated content is that they were taken in a real-world setting, hence close to what the targeting logos would look like in a film. For content selection and labelling, my own filtering tool and Yolo_Mark worked pretty well. It wasn’t easy to label 600+ images but the workflow is decent. The three classes are: 0 – Cadbury, 1 – ROSES, and 2 – HEROES. There are some typeface variations of ROSES. You need to be patient and consistent of the labelling strategy. As humans, we are able to acquire information from different sources very quickly while making a decision. So if I were actively looking for a particular logo while knowing the logo is definitely present, I could still point at an unidentifiable blob of pixels and be 100% certain that its a Cadbury logo on a discarded purple wrapper. It may not be realistic to expect a “low-level” machine learning model with a small training set to capture what human could do in this case. Therefore I limit the labelling to only the logos that I could visually identify directly.

Labelling a photo using Yolo_mark (Image copyrights belong to its owner)

The training process wasn’t much different from the previous modelling for Coca-cola logo except some further tidying of the dataset (minor issues with missing files, etc.). With a baseline configuration, it took about 6 hours to complete 6000 epochs with a pretty good result base on the detection of three logos.

The images below illustrate what the model picks up from some standard photos (using the slider to see “before” and “after”).

logo detection

Another example:

logo detection

I’ve also tested the model on some videos provided by our partner. I won’t be able to show it here due to copyrights but its safe to say that it works very well with room for improvements. Some adjustment can be done at the modelling side, such as increasing the size of training images (currently downsampled to 608×608), increasing the number of detection layers to accommodate a larger range of logo sizes, or perhaps giving the new YOLOv4 a go!

This update concludes the “Product detection in movies and TV shows using machine learning” series. The dataset used for Cadbury, Roses, and Heroes training will be made public for anyone interested in giving it a go or expanding her own logo detector. I am still pushing this topic forward and will start a new series soon!

Product detection in movies and TV shows using machine learning – part 1: Background

Product detection in movies and TV shows using machine learning – part 2: Dataset and implementations

Product detection in movies and TV shows using machine learning – part 3: Training and Results

Product detection in movies and TV shows using machine learning – part 4: Start a new dataset